Probabilistic Scheduling
Frequently I am asked what my schedule looks like to complete a program, or what is my projected complete date is for that program. The easy response - and the expected one - is to bring up your Gantt chart of the program plan and give the date at which it finishes. Lately this has felt more and more misleading. One thing I’ve spent time on over the last seven months of COVID is studying the mathematics behind machine learning. Studying statistical learning has lead me to think about probability distributions more, including Gantt charts. Complex projects are not deterministic. We cannot know their exact duration or outcome. Gantt charts are still useful to communicate a plan and a rough timeline. But too many times, they give their audience the excuse to believe that the schedule is firmer than it is. Incorporating probability distributions into a Gantt chart allows you to paint a picture of the program’s uncertainty along with it’s “expected” completion.
I have heard about commercial software for Monte Carlo simulations talked about with Gantt charts, but I have never seen any used. It seemed like a good package to try to write in code, so I have started it myself in Python. The start of my code can be found on my github site here. The code can reads in a simple comma delimited file of tasks, durations and predecessors1.
| TaskID | Task | Duration | Predecessors |
|---|---|---|---|
| 1 | Start | 0 | [] |
| 2 | Dig Hole | 5 | [1] |
| 3 | Pour Foundation | 2 | [2] |
| 4 | Rough Framing | 30 | [3] |
| 5 | Plumbing | 15 | [4] |
| 6 | Electrical | 31 | [4] |
| 7 | Finish Framing | 35 | [4] |
| 8 | Roofing | 6 | [4] |
| 9 | Dry Wall | 20 | [5-6-8] |
| 10 | Painting | 10 | [7] |
| 11 | Finish | 0 | [9-10] |
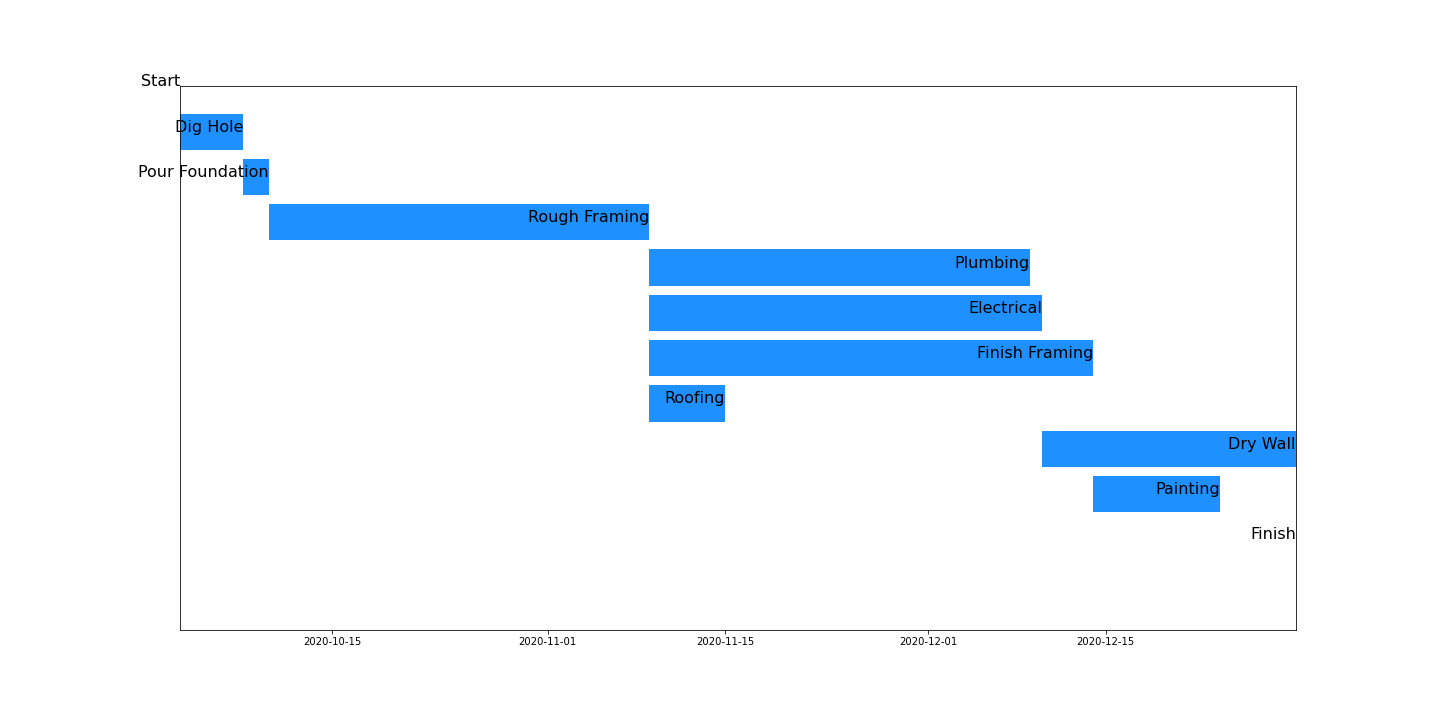
Once the file is read, the code can run a forward pass and backward pass of the tasks to find the projects total duration and critical path. A Gantt chart of the data can also be created:

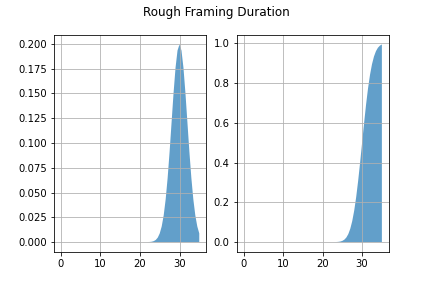
Everything has been single point to this point. Instead of taking the durations from the .csv table, task durations can be sampled from scipy.stats random distributions. Below is the distribution assigned to the duration of the rough framing task.

Other durations are assigned to other tasks. A probability distribution of the finish date of the project can be generated by sampling from each task’s probability distribution and calculating the total duration many times over.

The cumulative distribution function of the project date communicates the uncertainty in the project instead of just a single guess of the finish date.
The risk captured by sampling from the distributions in a Monte-Carlo simulation quantifies the uncertainty from the known sources.2. For example, I know that rough framing - even for identical houses - does not take the same amount of time every time. Different workers with different work ethics speed up or slow down the process. A rainy day stops work. But over time I should be able to collect enough data to be able to create a probability distribution that captures these consistent sources of variation. It does not capture the unknown risks: COVID, a strike, an earthquake, etc. In some instances, it may be that these types of unknown sources of variation can be safely neglected. In other cases it could be that while you can’t predict what your unknown source of variation is going to be, it’s almost certain that they’re will be one. This is the type of Radical Uncertainty that the book discussed in a previous post delved into in detail.
The more the program is dealing with radical uncertainty, the less useful this probabilistic scheduling will be. But if the radical uncertainty can be managed, and good estimates of probability distributions made, then I think this may be a useful approach.
1: Apologies if this a completely idiotic housebuilding plan.
2: I get peoples problems with Bayesian Statistics but it’s practical uses seem to beneficial to ignore